Did you know?
|
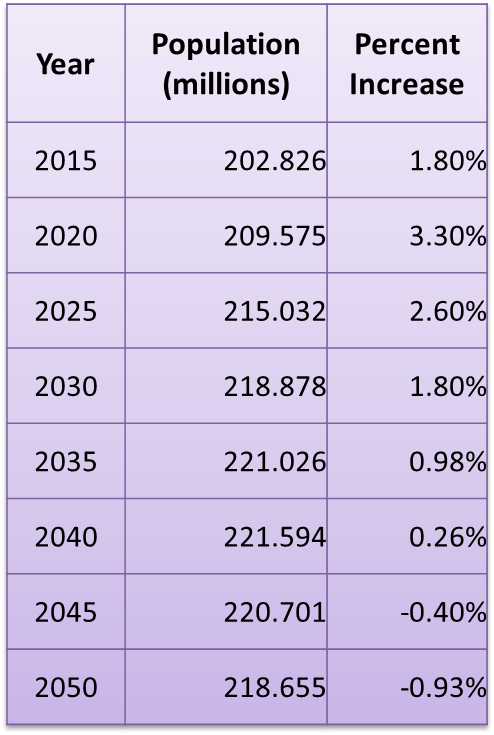
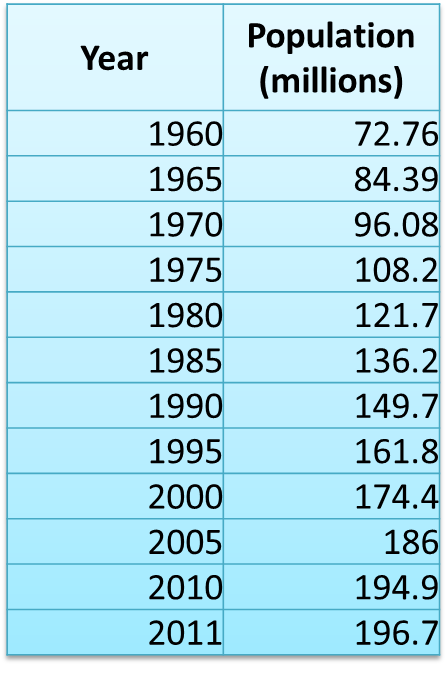
Historically, over the last half of a century, the population of the Federative Republic of Brazil has always increased. This growth has been fairly steady over the years, but has slightly slowed down in the recent decade.
The population of the Federative Republic of Brazil is projected to continue this trend of growth until approximately 2045. The birth rates are projected to decrease over the next 37 years. These rates range from 15.0 births per 1000 people to about 9.7 births per 1000 people. In contrast, the death rates are expected to increase from 6.9 deaths per 1000 people to about 11.4 deaths per 1000 people. Also, the net migration rate is expected to remain negative over the next 37 years, which is another reason as to why the population will eventually decrease. |
|
Population Pyramid of Brazil
|
Analysis...
As demonstrated in the population pyramid below for the country Brazil, the highest % of population in 2010 for both male and females is the age group 25-29, which take up roughly 5%. However the statistics on the pyramid also demonstrate that people aged 95 - 100+ is the smallest % of Brazil's population. The pyramid shows how the population of Brazil increases with a large % from 0, however the % decreases around the age 25-29. According the the statistics it is obvious that the largest percentage of Mexico is the age group 15-19 which take up roughly 11% of the population, male and female combined. The statistics then provide us with information of the smallest age group in Mexicos population which is 80-84. This pyramid starts at birth with a large percentage, this percentage the decreases around the age of 25-29 and then becomes lager again.The pyramid then narrows towards the top. This is because the death rate is higher among older people than among younger people. 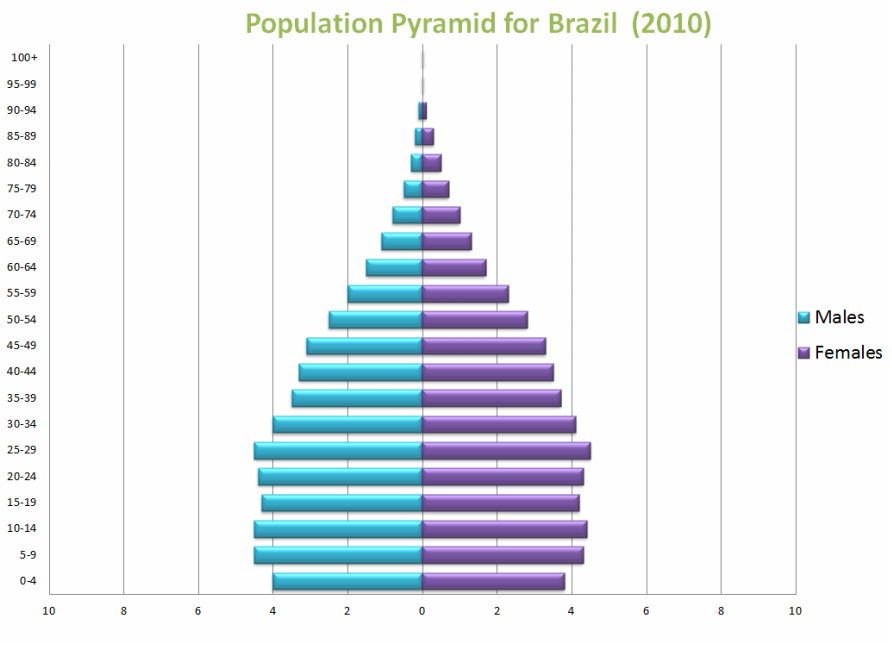
The above figure illustates the population of Brazil for both genders from the age of 0 to 100+
|
